

Code Profiler
Description
Table of Contents
Code Profiler is a powerful WordPress plugin built for developers and advanced users to analyze the performance impact of plugins, themes, and custom code. Unlike typical caching or speed optimization plugins, Code Profiler goes under the hood and pinpoints the root cause of slow load times by identifying which parts of your WordPress site are consuming the most resources.
With detailed profiling reports, stack traces, and resource usage breakdowns, it helps you optimize your site at the code level—whether you’re running an eCommerce site, a membership portal, or a content-heavy blog.
Components
Here are the main components that make Code Profiler an essential tool for performance diagnostics:
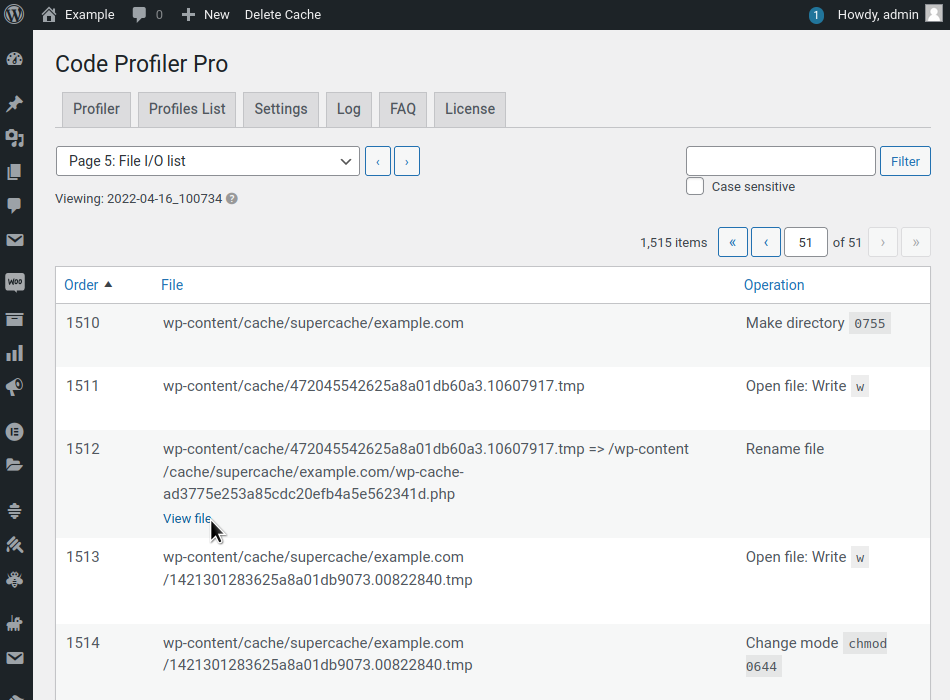
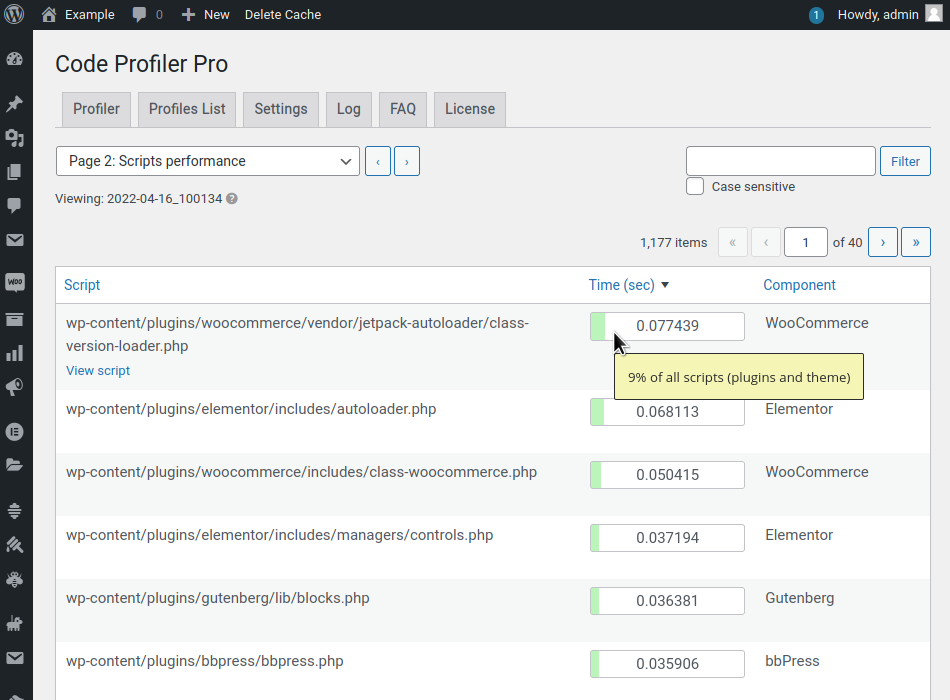
- Code-Level Analysis – Breaks down server-side processing to locate high-resource-consuming PHP scripts.
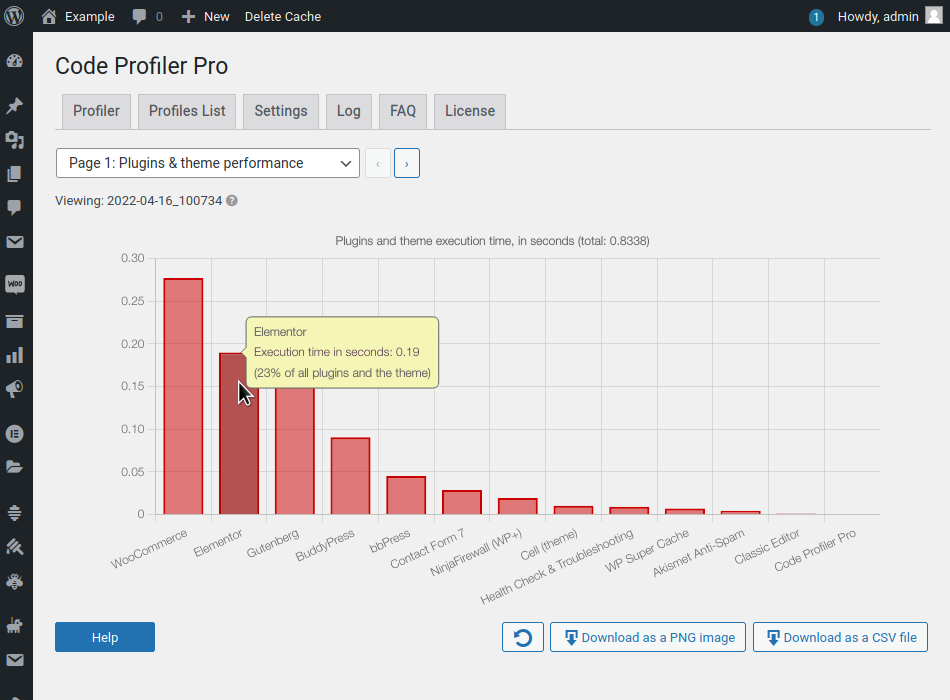
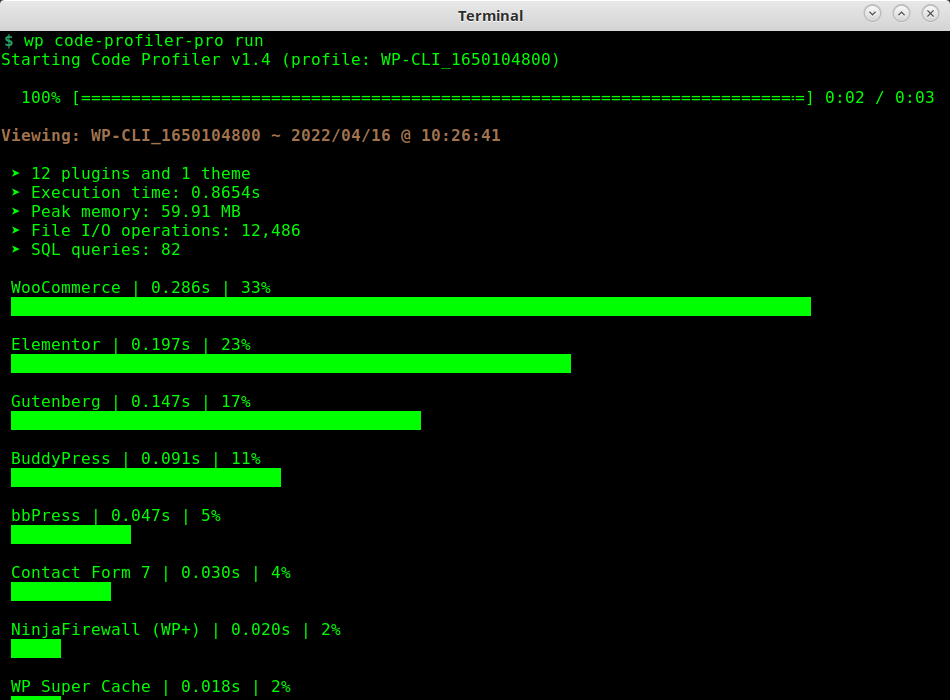
- Plugin & Theme Profiling – Identifies poorly performing plugins or themes with detailed impact reports.
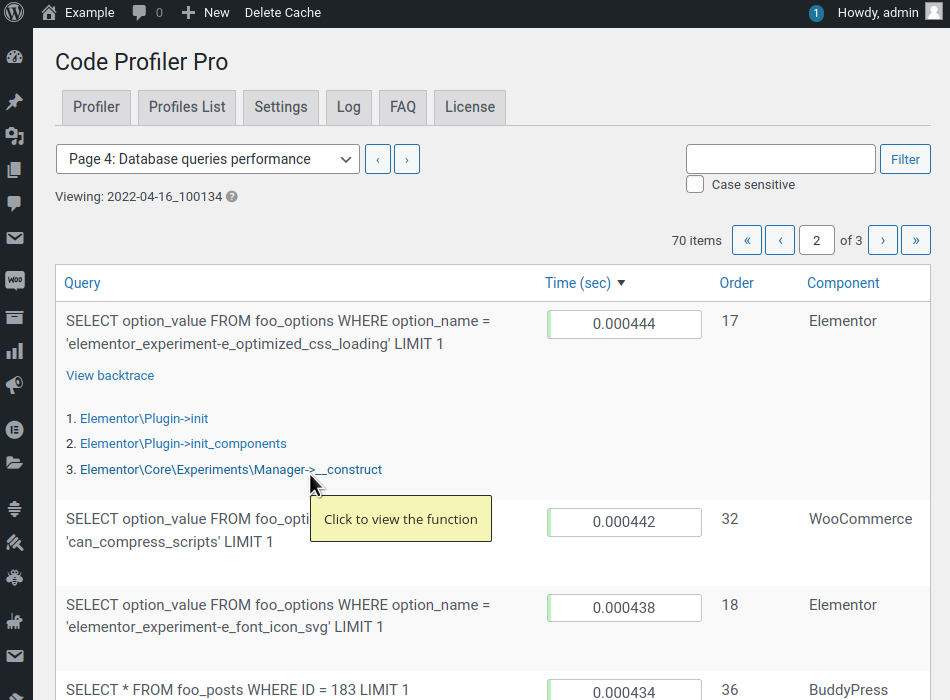
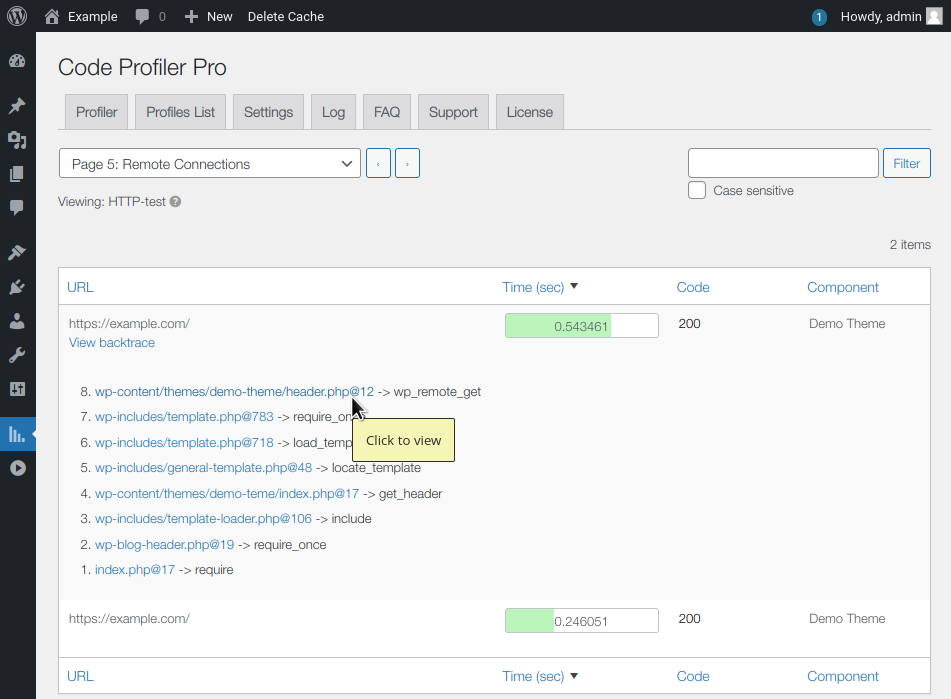
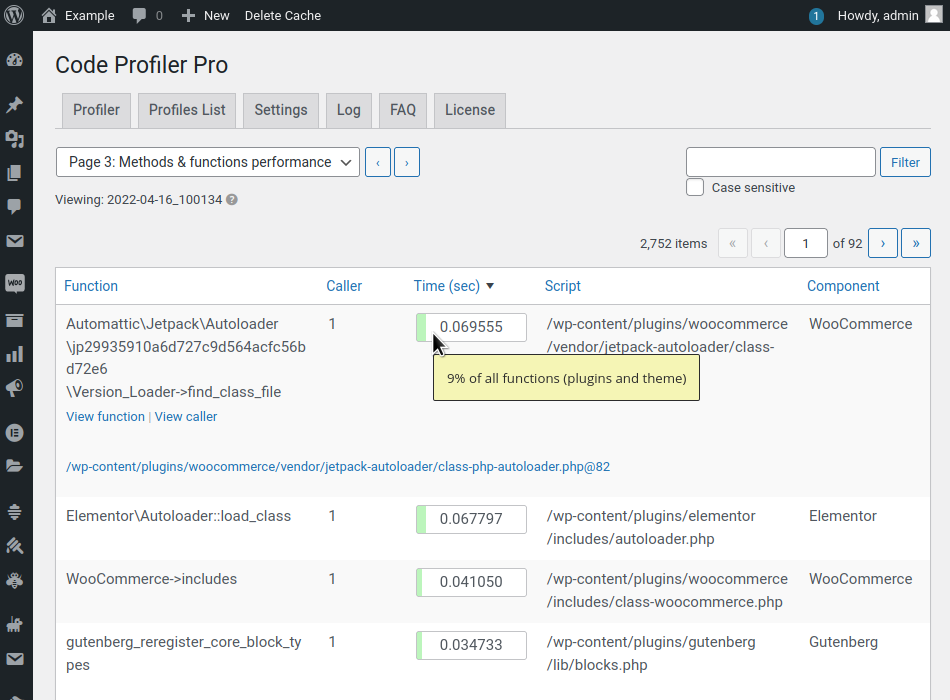
- Stack Traces – Provides full function traces to locate exactly where bottlenecks occur.
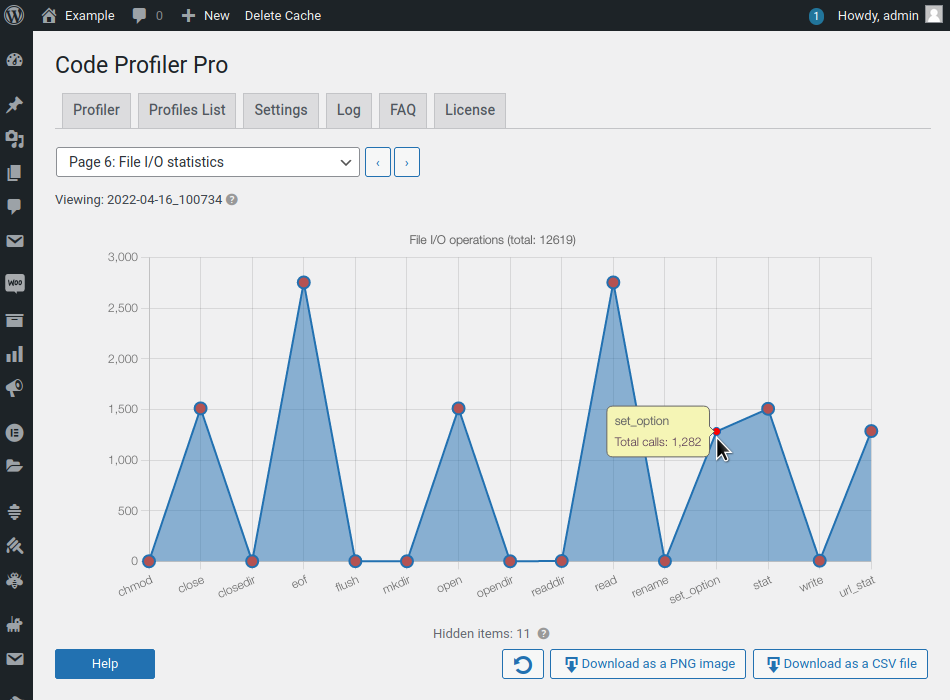
- Database Query Time Monitoring – Measures how much time is spent on database operations.
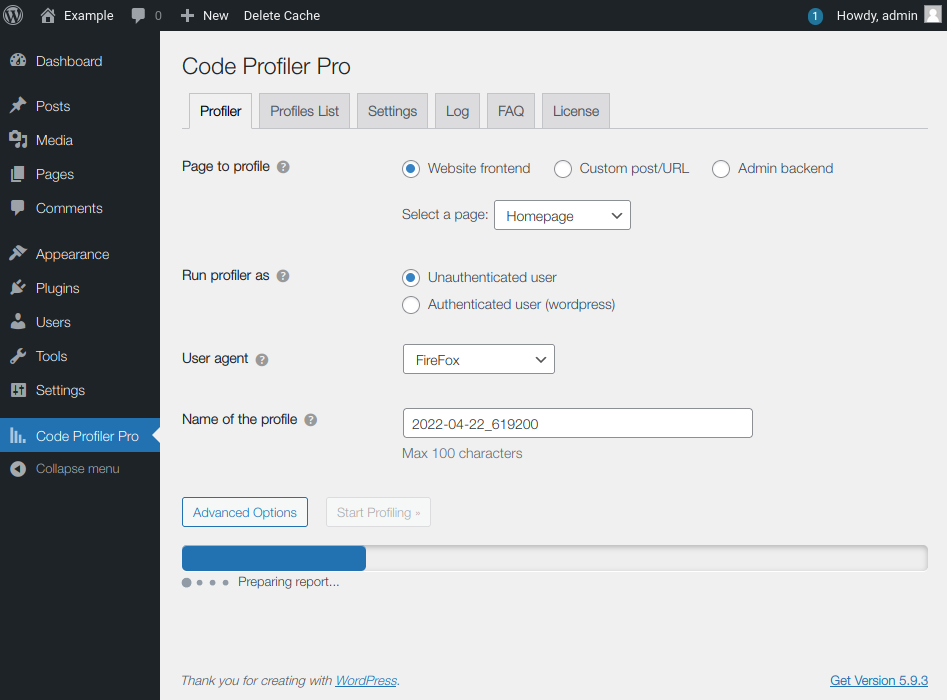
- URL-Based Profiling – Run profiling reports for specific URLs or actions on your website.
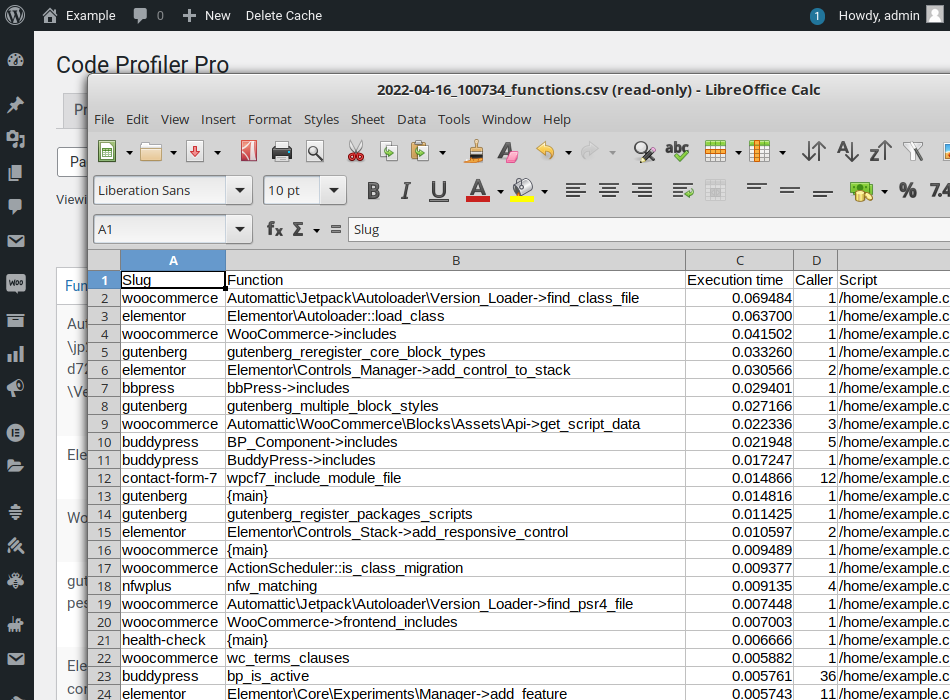
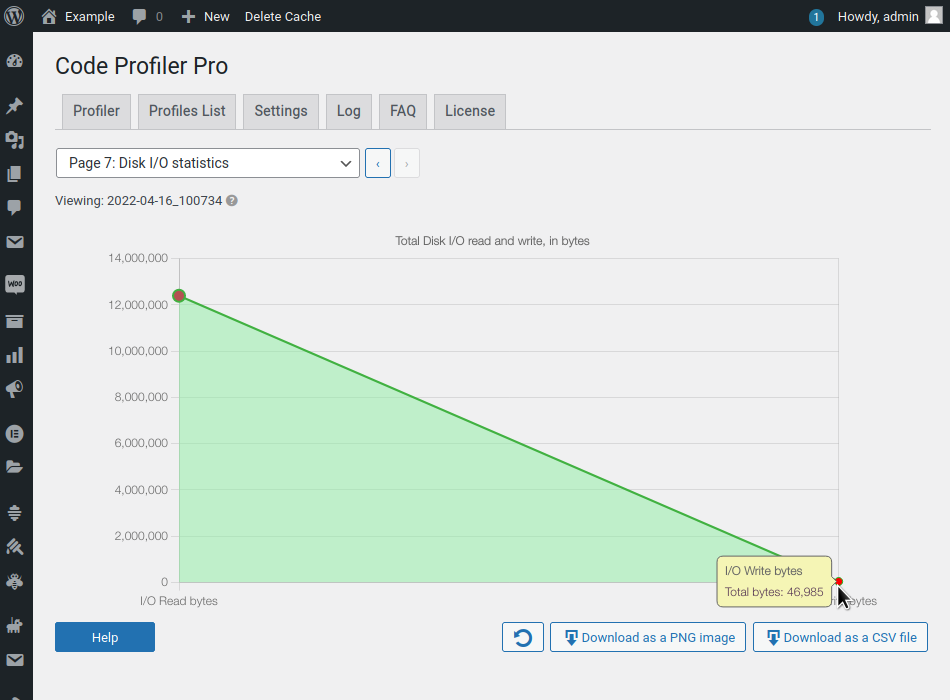
- Execution Time & Memory Usage – Get a complete picture of performance costs.
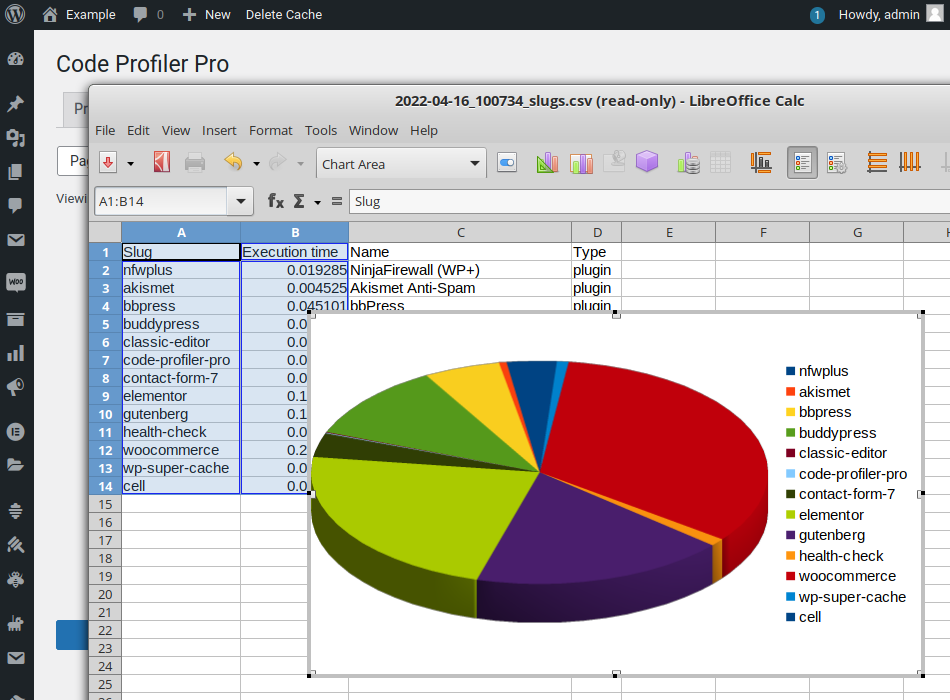
- Downloadable Reports – Export full profiling sessions in HTML for offline review.
Use Cases
1. WooCommerce Sites
Code Profiler identifies slow-performing product pages, checkout scripts, or third-party integrations that can hurt conversion rates.
2. LMS Platforms
On large course platforms (like LearnDash or Tutor LMS), it tracks heavy PHP operations during lesson loads, quizzes, and user interactions.
3. Membership or Subscription Sites
Helps developers analyze login flows, dashboard loads, or restricted content to reduce latency.
4. Custom Theme Developers
Theme authors can profile their own work and identify slow hooks, template files, or custom functions.
5. Plugin Developers
Useful for debugging plugin performance before release—identify excessive DB queries, slow actions, or API calls.
6. Large Multisite Networks
Detect site-specific issues on subsites or evaluate plugins that cause system-wide slowdowns.
Multisite Support
✅ Code Profiler supports WordPress Multisite. Network administrators can profile individual subsites and assess their plugin usage, database interactions, and execution time independently, helping maintain optimal performance across large networks.
Free vs Premium Plugin
| Feature | Free Version ✅ | Premium Version ✅ |
|---|---|---|
| Basic Code Profiling | ✅ | ✅ |
| Stack Trace Details | ❌ | ✅ |
| Exportable Reports | ❌ | ✅ |
| Profile Any Page (URL Targeting) | ✅ | ✅ |
| Profile AJAX & CRON Requests | ❌ | ✅ |
| Database Query Profiling | ❌ | ✅ |
| Premium Support | ❌ | ✅ |
| Multisite Specific Enhancements | ✅ | ✅ |
🔍 The free version is useful for lightweight diagnostics. However, for deep optimization and dev work, the premium version is a must.
Comparison with Similar Plugins
| Feature | Code Profiler | Query Monitor | Debug Bar |
|---|---|---|---|
| Plugin & Theme Performance | ✅ | ❌ | ❌ |
| Stack Trace View | ✅ (Premium) | ✅ | ❌ |
| Database Query Analysis | ✅ (Premium) | ✅ | ✅ |
| Export Reports | ✅ (Premium) | ❌ | ❌ |
| AJAX & CRON Profiling | ✅ (Premium) | ✅ | ❌ |
| Target Specific URL | ✅ | ❌ | ❌ |
| Developer Friendly UI | ✅ | Moderate | Basic |
💡 Query Monitor is more suited for query tracking, while Code Profiler is a complete performance diagnostic tool.
Frequently Asked Questions
1. What is Code Profiler used for?
It identifies the plugins, themes, and code snippets that slow down your WordPress site, enabling targeted optimizations.
2. Is Code Profiler safe to use on live sites?
Yes, though it adds minor load while profiling. It’s best to use during low-traffic periods or on staging environments.
3. Does it replace caching plugins?
No. It complements caching tools by helping developers detect underlying performance issues before caching is applied.
4. Can I export profiling data?
Yes, the premium version lets you download reports in HTML format for offline viewing or sharing with your dev team.
5. Will it help with WooCommerce speed issues?
Absolutely. It pinpoints slow cart, product, and checkout scripts that are hard to diagnose otherwise.
6. Is it developer-friendly?
Yes. It provides stack traces, function call timelines, and memory usage to help pinpoint exact bottlenecks.
7. Does it work with AJAX and REST APIs?
Yes, but only in the premium version, which supports background processes like CRON jobs, API requests, and AJAX actions.
8. Does it support WordPress Multisite?
Yes, it allows per-site profiling within a multisite environment, helpful for diagnosing individual subsite issues.
Videos: Code Profiler

Photos: Code Profiler


There are no reviews yet.